ZyrOSS
Data Collector for Polycom Products
|
||||||||||||||||||||
Version 2.3 includes a new report, the Disconnection Errors Report that lists conferences and participant with disconnection errors. This version will process the V9 MGC CDR events and will collect the CDR data from the new Polycom RMX platform.
Click Here for a full description of the enhancements in version 2.3.
Instructional Videos! The ZyrOSS Data Collector
automatically collects, interprets and delivers configurable Polycom MCU
usage data in a format easily processed by operations support systems
(OSS). Service providers
and enterprise accounting departments can use near real-time data to charge
for conferencing services based on actual usage data, such as the number
of participants or actual minutes used.Operations
Departments can ensure the proper accounting of conferencing and billing
activities. Based on customer-defined
schedules, the ZyrOSS Data Collector automatically queries the call detail
records (CDRs) produced by Polycom MCUs and gateways. ZyrOSS then automatically
correlates, assembles, and distributes the usage data in customer-configurable
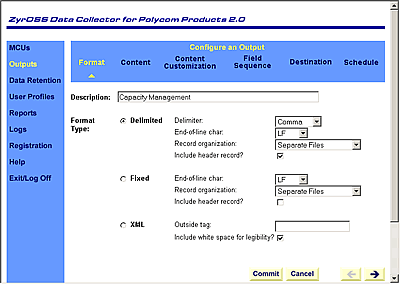
XML or ASCII formats. ZyrOSS offers flexibility by allowing the user to
select from a variety of reports or create custom output files to export
into existing operation support systems, such as quality and revenue assurance. Easy,
Browser-Based Interface Product
Specifications Supported
Platforms Supported
MCUs/Software Output
Options Output
Formats Frequently
Asked Questions
Insight Systems and Polycom worked together to create instructional videos for ZyrOSS, now available on Polycom Learning Center website. Click Here to view the videos. They begin with an overview of the product and then proceed with detailed instructions on its use.
Reporting
Options
![]()
Interactive
Conference Viewer — Allows online browsing
of conference data and "drilling down" to greater levels
of detail.
![]()
Conference
Summary Report — Lists conferences with
reserved and actual start date and duration, remarks,
billing code, end cause, type, transfer rate, and number
of participants.
![]()
Participant
Summary Report — Extends the Conference
Summary Report with key participant data, such as participant
name, transport types, and total connection time.
![]()
Conference
Rating Report — Lists conferences with calculated
prices or costs based on simple rating rules.
![]()
Connection
Attempts Report — Lists conferences requiring
multiple connections by the same participant.
![]()
Disconnection
Errors Report — Lists conferences and participants
with disconnection error.
![]()
Participant
Conferences Report — Lists conferences by
participant name. Most useful when participants are named
consistently by end point location or actual user name.
![]()
Conference
Statistics Report — Lists connections by
the same participant cumulative usage reporting by day,
week, or month.
![]()
Meeting
Room Statistics Report — Lists the number
of conferences and the actual start time of the most recent
conferece for each MGC meeting room conference template.
![]()
Time
of Day Usage Report — Provides a list of
the number of conferences, participants, and ports in
active use based on a selected time interval through the
day.The report default option is to report each date separately.
The report options ''Report Maximum Daily Value' and 'Report
Average Daily Value' will report the maximum or average
value for each time interval, over multiple days.
![]()
Conference
Usage Graph — Produces a line graph of the
conferences, participants, and connections by day.
![]()
Time
of Day Usage Graph — Produces a line graph,
showing the number of conferences, participants, and port
in active use minute-by-minute through the day. If
multiple days are selected in the date range, that graph
will plot either the maximum or average value for each
minute.
All report examples are in PDF format; Download
Adobe Acrobat Reader.
Windows
Linux x86
MGC Product Line
RMX Product Line
HTTP Post to Web Server
FTP Transport
Local File Output
XML
Delimited
Fixed width
Record
Set
For information on the record set produced by the ZyrOSS Data Collector,
refer to the Synthesized
Fields documentation.
How
do I acquire the ZyrOSS Data Collector?
Contact your Polycom reseller or
sales@zyross.com. You can also download
the Collector from this website. The Collector starts in demo
mode. In this mode, it discards some of the output data. Once you
register the product, however, you can regenerate the missing data.
How
many installations will my organization need?
Only
one installation is required regardless of the number of MCUs, provided
that all the MCUs are on the same network. However, each license is
configured to support a maximum number of MCUs per your purchase agreement.
What
are the minimum installation requirements?
Disk
space and technology requirements depend on your data needs (e.g.,
amount of data to be stored, length of time data is to be retained).
We typically recommend that you reserve around 1GB hard-disk space
for both the Collector software and collected usage data. If you have
concerns about installation requirements, contact the ZyrOSS
Product Manager.
![]()
| ©2001-2012
Insight Systems Inc. All rights reserved. |
